Monitoring with Prometheus + Loki + Alloy + Grafana

Recently I updated my monitoring with Prometheus (https://prometheus.io/), Grafana (https://grafana.com/), Loki (https://grafana.com/oss/loki/) and Grafana Alloy (https://grafana.com/docs/alloy/latest/).
Grafana Alloy is a relatively new software from Grafana combining node_exporter and promtail in one binary.
Setting up PLG-Stack
As always I'm using a docker-compose stack for my Grafana, Prometheus and Loki services. They are hosted on my homeserver. Data from cloud-servers is sent through FRP similar as I explained in my earlier blogposts about backing up.
version: '3.7'
services:
  loki:
    image: grafana/loki:latest
    volumes:
      - ./loki-config.yaml:/etc/loki/loki-config.yaml
      - /srv/monitoring-v2/loki:/loki:rw
    command: -config.file=/etc/loki/loki-config.yaml
    environment:
      - TZ=Europe/Berlin
    networks:
      - default

  prometheus:
    image: prom/prometheus:latest
    command:
      - --web.enable-remote-write-receiver
      - --config.file=/etc/prometheus/prometheus.yml
    volumes:
      - ./prometheus.yml:/etc/prometheus/prometheus.yml
      - /srv/monitoring-v2/prometheus:/prometheus:rw
    environment:
      - TZ=Europe/Berlin
    networks:
      - default

  metricproxy:
    image: marcel.aust/metric-proxy:latest
    environment:
      - BASIC_AUTH_USERNAME=xyz
      - BASIC_AUTH_PASSWORD=xyz
      - LOKI_ENDPOINT=http://loki:3100
      - PROMETHEUS_ENDPOINT=http://prometheus:9090
    ports:
      - "3190:3190"
    depends_on:
      - loki
      - prometheus
    networks:
      - default
      - frp

  grafana:
    image: grafana/grafana:latest
    volumes:
      - /srv/monitoring-v2/grafana:/var/lib/grafana:rw
    environment:
      - TZ=Europe/Berlin
    ports:
      - "3321:3000"
    networks:
      - default
      - frp

networks:
  frp:
    name: frp
    external: true
The most important configs is ``--web.enable-remote-write-receiver`` which enables prometheus api endpoint to push metrics via Alloy instead of scraping it. In addition I created a custom metricproxy go-reverse-proxy which
a) adds basic auth and
b) only exposed the log / metric ingestion endpoints
I've done this to improve security when exposing this endpoint via my cloud-server and FRP.
Configuring Grafana Alloy
Grafana Alloy can be installed easily by using the package manager of your distribution. It's not (yet) included in the primary repositories but can be added as an external repo.
I use Ubuntu/Debian for my machines so this is what I did (from offical docs):
sudo mkdir -p /etc/apt/keyrings/
wget -q -O - https://apt.grafana.com/gpg.key | gpg --dearmor | sudo tee /etc/apt/keyrings/grafana.gpg > /dev/null
echo "deb [signed-by=/etc/apt/keyrings/grafana.gpg] https://apt.grafana.com stable main" | sudo tee /etc/apt/sources.list.d/grafana.list
sudo apt-get update
sudo apt-get install alloy
sudo systemctl enable alloy
sudo systemctl start alloy
After this you can configure it. The config resides in ``/etc/alloy/config.alloy``:
prometheus.remote_write "local" {
  endpoint {
    url = "https://xyz/prom"
    basic_auth {
      username = "xyz"
      password = "xyz"
    }
  }
}

loki.write "local" {
  endpoint {
    url = "https://xyz/loki"
    basic_auth {
      username = "xyz"
      password = "xyz"
    }
  }
}

prometheus.scrape "linux_node" {
  targets = prometheus.exporter.unix.node.targets
  forward_to = [
    prometheus.remote_write.local.receiver,
  ]
}

prometheus.exporter.unix "node" {
}

loki.relabel "journal" {
  forward_to = []

  rule {
    source_labels = ["__journal__systemd_unit"]
    target_label  = "unit"
  }
  rule {
    source_labels = ["__journal__boot_id"]
    target_label  = "boot_id"
  }
  rule {
    source_labels = ["__journal__transport"]
    target_label  = "transport"
  }
  rule {
    source_labels = ["__journal_priority_keyword"]
    target_label  = "level"
  }
  rule {
    source_labels = ["__journal__hostname"]
    target_label  = "instance"
  }
}

discovery.relabel "logs_integrations_docker" {
    targets = []
    rule {
        target_label = "job"
        replacement = "integrations/docker"
    }
    rule {
        target_label = "instance"
        replacement = constants.hostname
    }
    rule {
        source_labels = ["__meta_docker_container_name"]
        regex = "/(.*)"
        target_label = "container"
    }
    rule {
        source_labels = ["__meta_docker_container_log_stream"]
        target_label = "stream"
    }
}

loki.source.journal "read" {
  forward_to = [
    loki.write.local.receiver,
  ]
  relabel_rules = loki.relabel.journal.rules
  labels = {
    "job" = "integrations/node_exporter",
  }
}

discovery.docker "linux" {
  host = "unix:///var/run/docker.sock"
}

loki.source.docker "docker_log" {
  host       = "unix:///var/run/docker.sock"
  targets    = discovery.docker.linux.targets
  labels     = {"app" = "docker"}
  relabel_rules = discovery.relabel.logs_integrations_docker.rules
  forward_to = [loki.write.local.receiver]
}
This will act as a node_exporter reporting key system metrics to prometheus and also tails logs of the system-journal and services, a s well as docker container logs running on the system. Logs & Metrics will be sent to my custom proxy
For Alloy to be able to access the docker socket I also added the alloy user - created during the install - to the docker group:
sudo usermod -aG docker alloyAdditions
My custom metrics proxy only consists of 60 lines of code and makes my log / metrics ingestion easier and more secure. My reverse proxy at my FRPs side is handling TLS:
package main

import (
	"fmt"
	"net/http"
	"net/http/httputil"
	"net/url"
	"os"
)

func getEnv(key, fallback string) string {
	if value, exists := os.LookupEnv(key); exists {
		return value
	}
	return fallback
}

func main() {
	baUser := getEnv("BASIC_AUTH_USERNAME", "")
	baPass := getEnv("BASIC_AUTH_PASSWORD", "")

	lokiEp := getEnv("LOKI_ENDPOINT", "")
	promEp := getEnv("PROMETHEUS_ENDPOINT", "")
	if lokiEp == "" || promEp == "" || baUser == "" || baPass == "" {
		panic("missing endpoint environment variable or basic auth environment variable")
	}

	rloki, err := url.Parse(lokiEp)
	if err != nil {
		panic(err)
	}
	rprom, err := url.Parse(promEp)
	if err != nil {
		panic(err)
	}

	handler := func(p *httputil.ReverseProxy, ep *url.URL, path string) func(http.ResponseWriter, *http.Request) {
		return func(w http.ResponseWriter, r *http.Request) {

			username, password, ok := r.BasicAuth()
			if !ok || username != baUser || password != baPass {
				w.WriteHeader(http.StatusForbidden)
				w.Write([]byte("invalid credentials"))
				return
			}

			r.Host = ep.Host
			r.URL.Path = path
			r.URL.Host = ep.Host
			p.ServeHTTP(w, r)
		}
	}
	proxyLoki := httputil.NewSingleHostReverseProxy(rloki)
	proxyProm := httputil.NewSingleHostReverseProxy(rprom)
	http.HandleFunc("/loki", handler(proxyLoki, rloki, "/loki/api/v1/push"))
	http.HandleFunc("/prom", handler(proxyProm, rprom, "/api/v1/write"))

	fmt.Println("Starting on :3190 ...")
	http.ListenAndServe(":3190", nil)
}
Disabling Usage Statistics
As I dont like my monitoring software monitoring me, I also recommend disabling the "anonymouse usage statistics". You can do it by editing ``/etc/default/alloy`` and adding
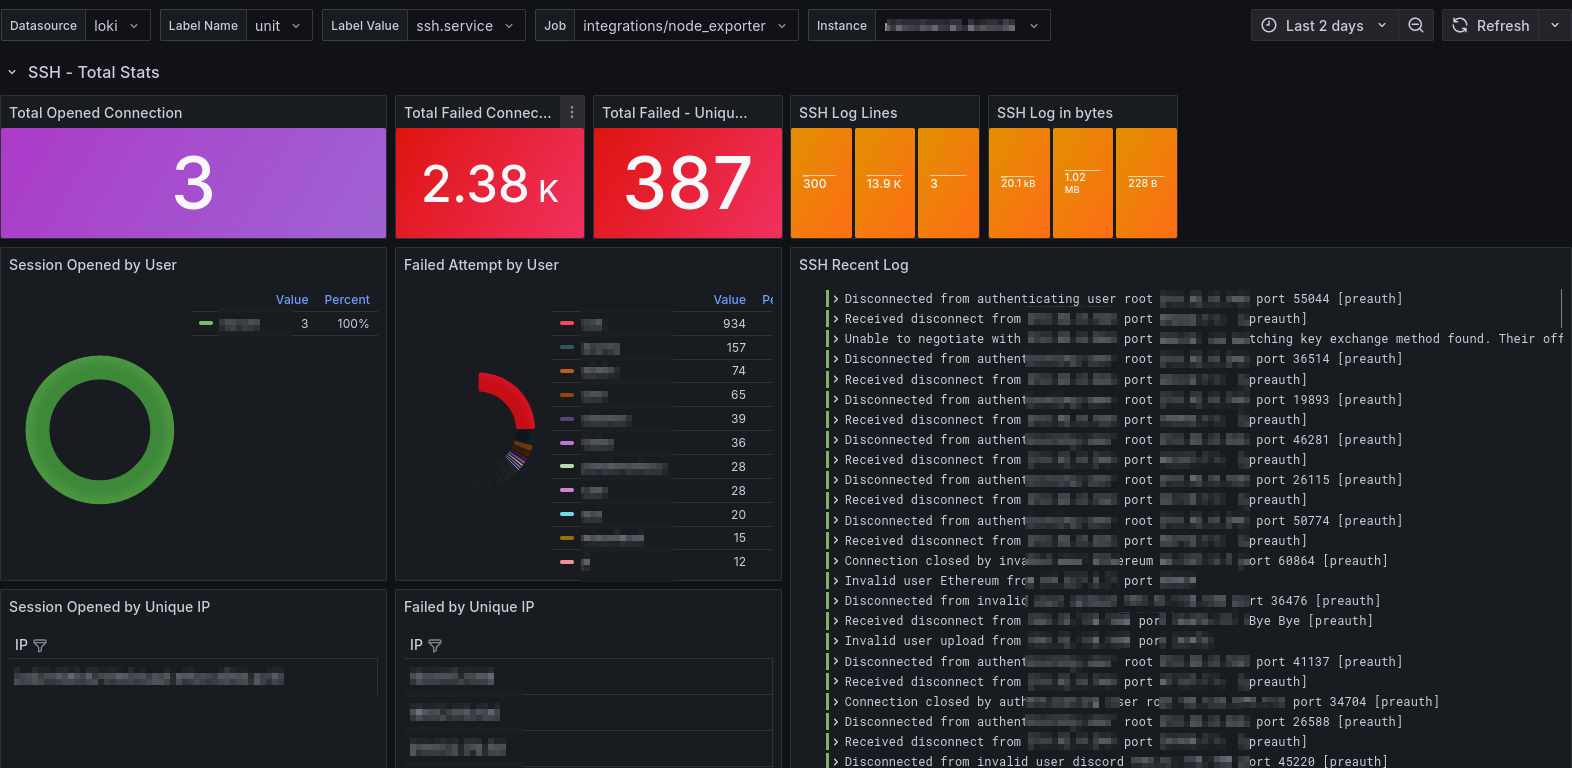
CUSTOM_ARGS="--disable-reporting"Thats it. With this simple setup I now have Full metrics of my servers available at home. In the next post I'll show a few useful dashboards I found or created myself to monitor SSH login attempts or E-Mail delivery via Postgres (and Mailcow)


